Our peer group analysis tools provides a comprehensive comparison of different companies.
Companies can be compared based on single periods or based on the growth rate between two periods.
All 160 financial metrics are available for comparison in the peer group analysis.
Similar to the analysis of a single company, the peer group analysis can be performed based on reported or standardized figures.
Automatic currency conversion
Absolute figures (e.g. Revenue or Free Cash Flow) from companies with different reporting currencies will be converted automatically to the target currency selected by the user.
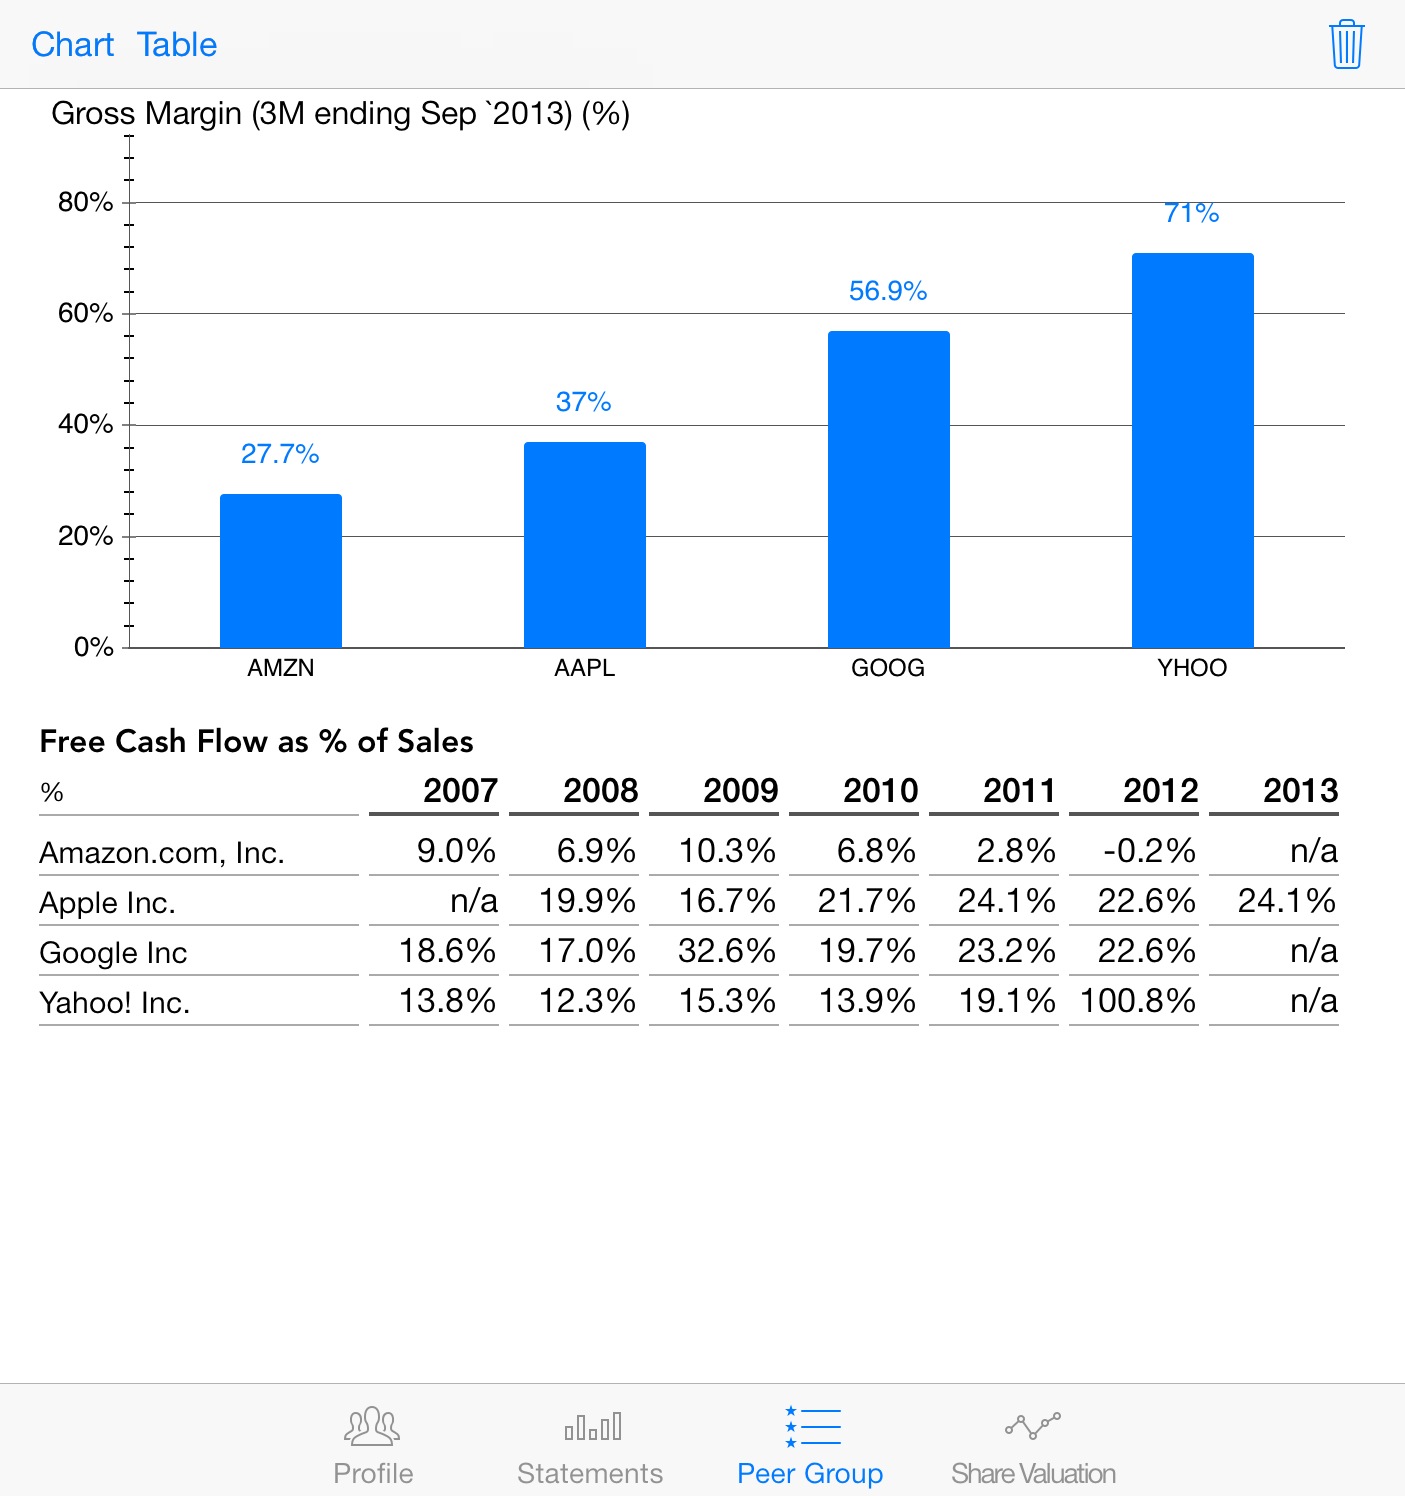
Interactive Charts
Our charts are fully interactive. To plot a financial metric in the chart, just select it with one click from the table.